Specs on a speaker?

Dvddvd

Wammer
Wammer
Dec 2, 2015
527
21
0
York
AKA
Graham
HiFi Trade?
  1. No
I was looking at different specifacation on certain speakers

minimum frequency response:

B and W  805d3. 42 htz 

Kef reference 1 45htz

and the Kef reference model 2 floor standers (from the 90s) 43htz ?

So can the 805d3 produce a 42 htz tone with its 1 165mm driver that the kef model 2 can not with its 2 X 160mm drivers?

how would you describe all three speakers? If you compare them to each other?

 
Last edited by a moderator:

Beobloke

Wammer
Wammer
Jul 29, 2005
7,661
1
4,464
158
AKA
Adam
HiFi Trade?
  1. No
All of them will produce 42Hz to be but the question is, how loudly? Really you need the full specification that shows by how much the outputs have dropped at these frequencies (-3dB for example).

 
  • Upvote
Reactions: tuga

tuga

. . .
Wammer
Aug 17, 2007
14,342
7,000
173
Oxen's ford, UK
AKA
Ricardo
HiFi Trade?
  1. No
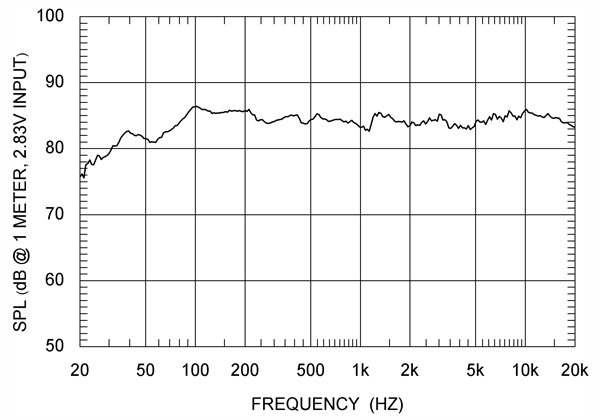
This is the anechoic frequency response plot for the Kef Reference 1:

fr_on1530.gif


As you can see, the woofers roll-off at around 90Hz, then the port kicks-in at around 40Hz.


tuga

. . .
Wammer
Aug 17, 2007
14,342
7,000
173
Oxen's ford, UK
AKA
Ricardo
HiFi Trade?
  1. No
The following is from a Bowers & Wilkins 805 D3:

317BW805fig03.jpg


As you can see the woofer rolls-off at a higher frequency and the port seem tuned at 50Hz.

Ignore the amplitude as these were not made in anechoic environment.

800 series BnWs are not as bad as the other ranges but they're still  :td:


tuga

. . .
Wammer
Aug 17, 2007
14,342
7,000
173
Oxen's ford, UK
AKA
Ricardo
HiFi Trade?
  1. No
There are three variables responsible for low frequency response - cabinet size, cone surface and cone excursion - and two of them must be satisfied.

Ports and transmission lines are crutches which allow further low end extension.


uzzy

Grumpy Old Git
Wammer
Apr 16, 2006
8,562
4,610
158
NN38TA Northampton
AKA
David
HiFi Trade?
  1. No
Of course all these graphs will not apply to your lounge which will have its own affect on the frequency response.    but in general a speaker that has a fairly flat frequency response down to 40 hertz should produce copious amounts of bass ..

If you google a loudspeaker and its frequency range images (e.g. B&W 805 frequency response images) you will see the response across the frequency band in numerous graphs which will show you how flat the response curve is.  

As to the quality of that sound well that is another story ... 

It is also worth noting (if you listen to Rock Music .. the lowest achievable pitch of 41 hertz but in general most bass signals on modern music lay between 90 and 200 hertz. 

The lowest note on a piano is 27.5 hertz.  I am not sure how many times that bottom note is actually struck in most pieces and of course there are a load of other harmonics produced by the strings.   

You might find this article useful on frequencies on recorded music .. https://www.teachmeaudio.com/mixing/techniques/audio-spectrum/ 


tuga

. . .
Wammer
Aug 17, 2007
14,342
7,000
173
Oxen's ford, UK
AKA
Ricardo
HiFi Trade?
  1. No
Gated in-room measurements, such as those performed by John Atkinson and published by Stereophile, do not provide an accurate portrait of the speaker's anechoich performance below 300Hz.

That is why all Stereophile measurements exhibit a ~6dB bump around 100Hz:

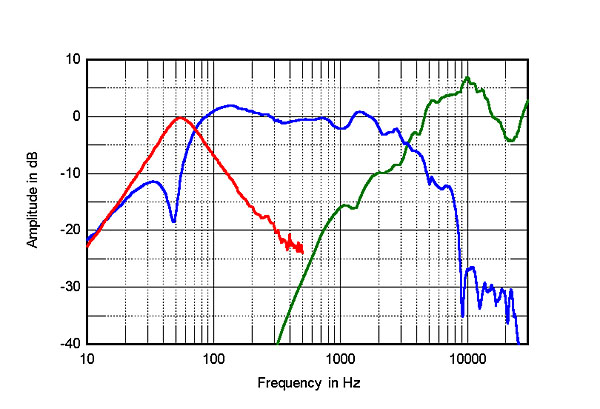
708Revfig04.jpg


Revel Ultima Salon2, anechoic response without grille on listening axis at 50",
averaged across 30° horizontal window and corrected for microphone response,
with the complex sum of the nearfield responses plotted below 300Hz.
 
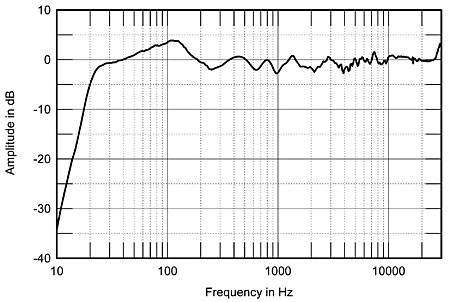
frequency_listeningwindow.gif

Revel Ultima Salon2, Listening Window, 20Hz - 20kHz (measured @ 2m, plotted @ 1m)
Response curve is an average of five measurements: on-axis, 15 degrees left and right off-axis,
15 degrees up and down off-axis.

.
From Stereophile's "Measuring Loudspeakers" article by JA:
For published graphs, the loudspeaker's nearfield response is spliced to the farfield response in the 300Hz region.

However, as pointed out in the Keele paper, the nearfield response assumes a 2-pi or half-space loading for the drive-units—close coupling to the room boundaries.

This results in an apparent low-frequency boost in the resultant composite graph compared with a true anechoic response made of the same speaker.

Given that a loudspeaker's woofer and port are always within a fraction of a wavelength from one boundary—the floor—and almost always less than one wavelength from three other boundaries—the walls and ceiling—below 100Hz or so, my experience has been that this does give a truer representation of a loudspeaker's real low-frequency performance than the anechoic response in all but extremely large rooms.

Certainly, the loudspeakers I have auditioned that have true, flat anechoic extension to very low frequencies sound as if they have a somewhat exaggerated bass response—which is how they appear with a nearfield measurement.

Read more at https://www.stereophile.com/content/measuring-loudspeakers-part-three-page-6

.

These are Alan Shaw's comments in regards to JA's measuring methods:

Making high-quality loudspeaker measurements that can be confidently repeated by other researchers is not easy, and is far more difficult now that big, expensive anechoic chambers with controlled, reflection-free environments are rare—and expensive and inconvenient to hire.

The advent of low-cost, computerized, audio measuring systems in the 1990s (to replace paper charts) led to the idea that one could synthesize a quasi-anechoic response on the kitchen table by placing the microphone near to the low/mid-frequency drivers, capturing their nearfield frequency-response measurements and then, at one's leisure, manipulating them mathematically to mimic a true (farfield) anechoic response.

A brilliant cost-saving idea! When a microphone is placed very close to a drive-unit—in its nearfield—the sound received by the microphone is very loud indeed, and although there are still strong reflections from the local nonanechoic test environment, the concept is that the direct sound will be sufficiently loud to swamp these unwanted echoes.

This is only partially true, and one of numerous assumptions that must be made when measuring nearfield without a real chamber.

Another variable at the heart of the maths is, "What is the radiating area of each driver or vent?"

A ruler held to a drive-unit such as the M40.1's 8" midrange unit does not tell you with accuracy its effective area.

All these horrible little variables and fiddle factors have to be considered—and be consistent and correct—when using a maths model, and I take my hat off to anyone who has the confidence to totally trust those results.

Read more at https://www.stereophile.com/content/harbeth-m401-loudspeaker-manufacturers-response
 

tuga

. . .
Wammer
Aug 17, 2007
14,342
7,000
173
Oxen's ford, UK
AKA
Ricardo
HiFi Trade?
  1. No
One should also note that John Atkinson's frequency response plots are not made on-axis but averaged across 30° horizontal window:

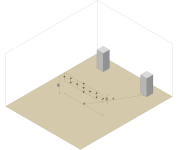
There is a problem with taking the response at just one point in that there is almost too much information. Some of the fine detail will be specific to just that one point in space. With a loudspeaker whose drive-units are mounted in some kind of vertical array, it seemed sensible to implement some kind of spatial averaging. This would smooth out any position-dependent wrinkles in the measured response, while leaving the significant information intact. Accordingly, my published responses are the average of seven measured responses, taken at 5 degree intervals across a 30 degrees horizontal window on the reference axis.
Read more at https://www.stereophile.com/content/measuring-loudspeakers-part-three-page-2
 
The different positions of the mic could look something like this:

_mic_positions.png


Latest posts

Forum statistics

Threads
113,444
Messages
2,451,263
Members
70,783
Latest member
reg66

Latest Articles